The big plan had been to write up my MSc project – VideoTag into a paper and get it published. It has been over 12 months now since I finished this experiment and my ideas have moved on, I am all to aware of the short comings of the project in terms of academic paper. And I guess, if I am going to publish something, I want to be proud of it. Not that I’m not proud of VideoTag, but it needs a lot of improving. I have so many ideas of where I can push this concept for my PhD, that I want to spend my time doing that, rather than re-writing something I did 12 months ago.
However, I figured it would be a shame to never have the results of the experiment somewhere, as I did find out some stuff!! I found out enough to warrant me being able to continue researching the concept of video tagging games for the next 3 years.
So here they are, mostly for my own benefit so I have somewhere to reference the experiment if necessary in future work. I am sure my traffic will go through the roof with interest in these!!
VideoTag – A game to encourage tagging of videos to improve accessibility and search.
Results
Data Collection/Tag Analysis
Data Collection
Usage was monitored over a month long period, after which the dataset for analysis was downloaded. Data was analysed for the period July 30th 2007 – September 2nd 2007. Data was also included from the user testing phase, July 15th 2007 – July 30th 2007
Tag Analysis
Quantitative methods of evaluating the VideoTag data involved analysis of sets of tags for a Zipf distribution on a graph. Furnas et al. (1998) discuss how power law distribution demonstrates the 80-20 rule. While 20% of the tags have high frequency and therefore a higher probability of agreement on terms, 80% have low frequency and corresponding low probability. When the tags are inspected for cognitive level, Cattutto et al. (2007) discovered that high rank, high frequency tags are of basic cognitive level, where as low rank, low frequency tags are of subordinate cognitive level. In terms of analysing VideoTag data this is a useful method to determine whether the game has been effective at improving the specificity of tags, in order that a greater number of subordinate level tags can create user descriptions of video to improve video accessibility. Following the 80-20 rule, an overall increase in the amount of tags would increase the amount of basic level tags that have a high probability of agreement on terms, improving video search. Drawing comparisons between the quantity of tags per video generated through VideoTag in relation to tags per video assigned in YouTube, will indicate whether VideoTag has been successful at increasing the amount of tags and therefore could be a useful tool at improving video search. A paired t-test analysis was conducted to statistically qualify the comparison results.
Tag type was evaluated using qualitative methods, both YouTube and VideoTag tags were analysed for evidence of Golder and Huberman (2005) tag types and comparisons drawn.
Results
General usage analysis revealed that 243 games were played in total during the experimental period. 87 of those games were discounted because the game points score was 0, indicating that the players had not tagged any videos. 37 of those discounted games were guest users (i.e. who did not log in). The 156 valid games were played by 96 unique users, meaning that some users played more than one game. Of the 96 unique users, 73 were registered, 23 were guests.
Table 1 % of tags entered ordered by Tagging Support
Blind tags, as defined by Marlow et al. (2006), are free tags entered without prompting the user with suggestions (suggested tagging). Guided tagging, as introduced by Bar Ilan et al. (2006) gives structure to tagging by offering the user guidelines. During the 156 valid games, a total of 4490 tags were entered. 4076 of these were Blind, 68 were Guided and 346 were Pitfalls (Fig 1). The substantial preference for blind over guided tagging means that the tag data generated by VideoTag in this experiment can not be used to compare the cognitive levels of blind or guided tags. Tag analysis therefore compared blind tags and pitfalls and omitted the suggestion differential.
Fig 1 Frequency of blind tags per video
The long tail effect apparent when blind tag frequencies are plotted on a graph, fig 1, has evidence of a Zipf distribution. The vast majority of tags, 52.9 % occur only once. In relation to the research findings of Cattuto et al. (2007) and Golder and Huberman (2005), fig 1 would suggest that VideoTag generates an increased number of subordinate level, descriptive tags over basic level tags of high frequency.
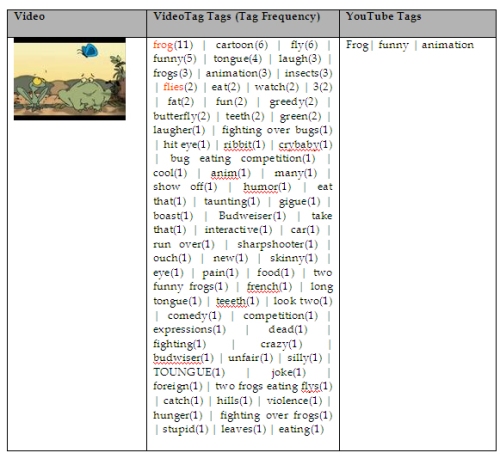
This finding is emphasised when examining fig 2 which plots the pitfall frequency. Pitfalls were created as basic cognitive level; they were the tags that were expected to have the least cognitive cost. It was expected that these tags would have high frequency, as they would be the tags that came to a players mind first. Few low frequency tags were expected if the basic level tags for each video had been predicted successfully. Partial success is shown, with only 20.23% of pitfalls occurring once. This occurrence can be explained by the fact that the majority of users played level one. Inspection of the tag data (Table 2 provides an example of tag data for a video in level 1) revealed that the majority of high frequency pitfall tags were assigned to videos in Level 1, the most played level. Therefore it could be expected that if the levels of VideoTag had been played more evenly then there would be a lower percentage of low frequency tags.
The low amount of pitfall tags (346 out of 4490) coupled with the high frequency of low frequency blind tags, is an indication of the success of the gameplay element of encouraging users to avoid pitfalls and enter more subordinate cognitive level tags. It has contributed to VideoTag’s effectiveness as a tool for generating more descriptive tags.
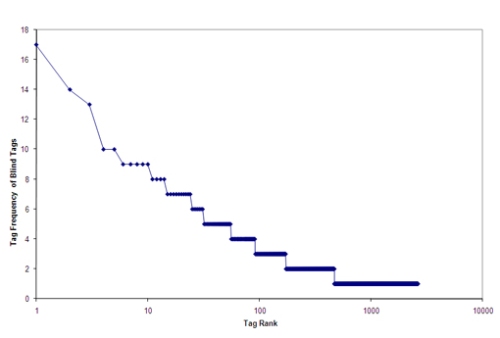
This is further implied by analysing the frequency of all tags entered, as shown in fig 3. This graph shows a clear long tail effect, with the majority of tags entered having low frequency. Whilst the high frequency tags are useful for video search, because agreement on terms will be reached quicker, the low frequency tags are important as there is a likelihood that out of the billions of internet users, at least one other user will agree on a term. The amount of tags entered, and the high amount of low frequency tags implies that VideoTag has been successful at generating a large amount of high quality tags that can be used to create descriptions of the videos for visually impaired users. If high agreement was present for all tags, then there would not be enough variety in the tags to sufficiently create the descriptions.
This result is further evident in Fig 4, which represents the frequency of all tags frequency and shows the appearance of a power law (i.e. a straight line in a log-log scale). There is a greater frequency of low frequency tags, which is a pleasing result as this was the main aim of the project, to encourage users to tag videos with more descriptive tags. By generating more low frequency, subordinate level tags, more useful descriptions can be created to improve internet video accessibility.
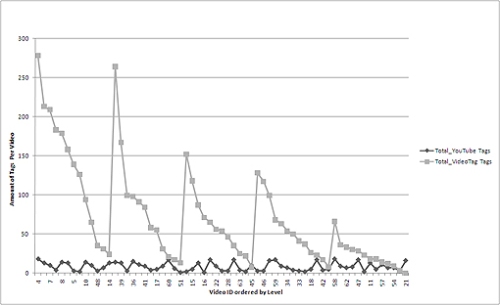
Analysis suggests that VideoTag has been successful at increasing the amount of tags entered for each video. Geisler, G. and Burns, S. (2007) found the average amount of tags on YouTube to be 6. The average number of tags per video in VideoTag compares very favourably at 71.3. Fig 5 clearly shows this increase in tags generated by VideoTag compared to the tags entered for each video in YouTube. The tags are grouped by Video Id and ordered by levels 1-5 ascending. An interesting anomaly in the graph shows an increased number of tags for one video at each level, indicating that out of a purely random selection, one video was selected more times. With the graph alone it can be said that VideoTag created more tags for videos than are entered on YouTube, which could be beneficial to both video search and accessibility. A paired t-test of the amount of tags entered both on VideoTag and YouTube returned a p value of 0.000 which shows that this difference is statistically significant, proving that a game environment encourages more tags for videos.
Tag Type Analysis
The majority of VideoTag tags are single word, which is interesting as a conscious decision was made to not limit the format in which users could enter tags, as it was believed all tags regardless of format are useful at improving meta data for a video. Del.icio.us only allows single word tags as do other systems but some such as Last.fm allow multi word tags. It is interesting that the majority of users automatically tag as a single word and do not think to enter full phrase descriptions. It would be interesting to find out if experience at tagging affects the types of tags entered, with more experienced taggers using single word tags as pre-conditioned by systems like del.icio.us, and novice users entering a more varied range of single and multi word tags.
Table 2 compares the VideoTag and YouTube tags. Using this example the types of tag entered can be analysed in relation to the Golder and Huberman (2005) definitions of tag type. YouTube tags can be found to fall into the social tag functions of What or Who it is about (e.g. frog), and Qualities Or Characteristics (e.g. animation and funny) with funny being an Opinion Expression tag. VideoTag tags also have social tag functions and similarly to YouTube tags, are primarily What or Who it is about (e.g. frog, fly, two frogs eating flys) and Qualities Or Characteristics (e.g. cartoon, comedy, taunting, greedy). Few of the Qualities Or Characteristics tags were Opinion Expression tags. The majority of the tags describe the characters, objects or actions in the videos with a few Opinion Expression tags (e.g. funny, humour, silly). It is surprising that not more Opinion Expression tags were entered, they are particularly useful at categorising videos as well as formulating descriptions. It would be interesting to find out, in future research, whether the gameplay of VideoTag deterred users from entering opinion expression tags, by comparing the frequency of Opinion Expression tags to those in tagging systems such as del.icio.us. These results were general for all videos. This analysis implies that VideoTag managed to successfully encourage users to enter more descriptive tags for the videos.
This webpage has been created that shows thumbnails of each of the videos in VideoTag and lists the VideoTag tags generated as well as the original YouTube tags.

Table 2 Table comparing tags entered during the VideoTag experiment and YouTube tags for one example video from the VideoTag database.
References
BAR-ILAN, J., SHOHAM, S., IDAN, A., MILLER, Y. & SHACHAK, A. (2006) Structured vs. unstructured tagging ? A case study. Proceedings of the Collaborative Web Tagging Workshop (WWW ’06), Edinburgh, Scotland.
CATTUTO, C., LORETO, V. & PIETRONERO, L. (2007) Semiotic dynamics and collaborative tagging. Proceedings of the National Academy of Sciences (PNAS), 104(5), pp. 1461-1464.
FURNAS, G.W., LANDAUER, T.K., GOMEZ, L.M., DUMAIS, S. T. (1987) The vocabulary problem in human-system communication. Communications of the Association for Computing Machinery, 30(11), pp. 964-971.
GEISLER, G. and BURNS, S. (2007) Tagging video: conventions and strategies of the YouTube community. JCDL ’07: Proceedings of the 2007 conference on Digital libraries, pp. 480-480
GOLDER, S. & HUBERMAN, B. (2005) The Structure of Collaborative Tagging Systems [Online]. Available from:http://arxiv.org/abs/cs.DL/0508082 [cited 09-03-2007]
MARLOW, C., NAAMAN, M., BOYD, D. & DAVIS, M. (2006) HT06, tagging paper, taxonomy, Flickr, academic article, to read. HYPERTEXT ’06: Proceedings of the seventeenth conference on Hypertext and hypermedia, pp. 31-40.


Hi there,
Thanks for posting the results of your project, they were an interesting read.
Can I ask where you are taking your PhD and where you took your MSc? I’m looking for similar opportunities for myself.
Also, what is your background in terms of your degree? I assume you have studied computer science. Have you also studied statistics?
Pingback: What makes MMOG’s so popular? « Web 2.0 research – tagging, social networks, folksonomies.